Digital assets ended the week lower as an early rally gave way to risk aversion across markets. Bitcoin closed Sunday at about $80,150, down 2.4% on the week, and traded around $79,600 early Monday. The move reversed a push to $84,879 on Wednesday. On Thursday, Bitcoin lost support at $82,500 as the Nasdaq Composite fell 2.6%, and a Saturday low of about $79,150 marked its weakest level in more than a month. Ether underperformed, falling roughly 4% over seven days to around $2,320, and is now about 18% lower year to date. In our view, the week showed that digital assets still trade as a high-beta extension of equities rather than as a hedge.
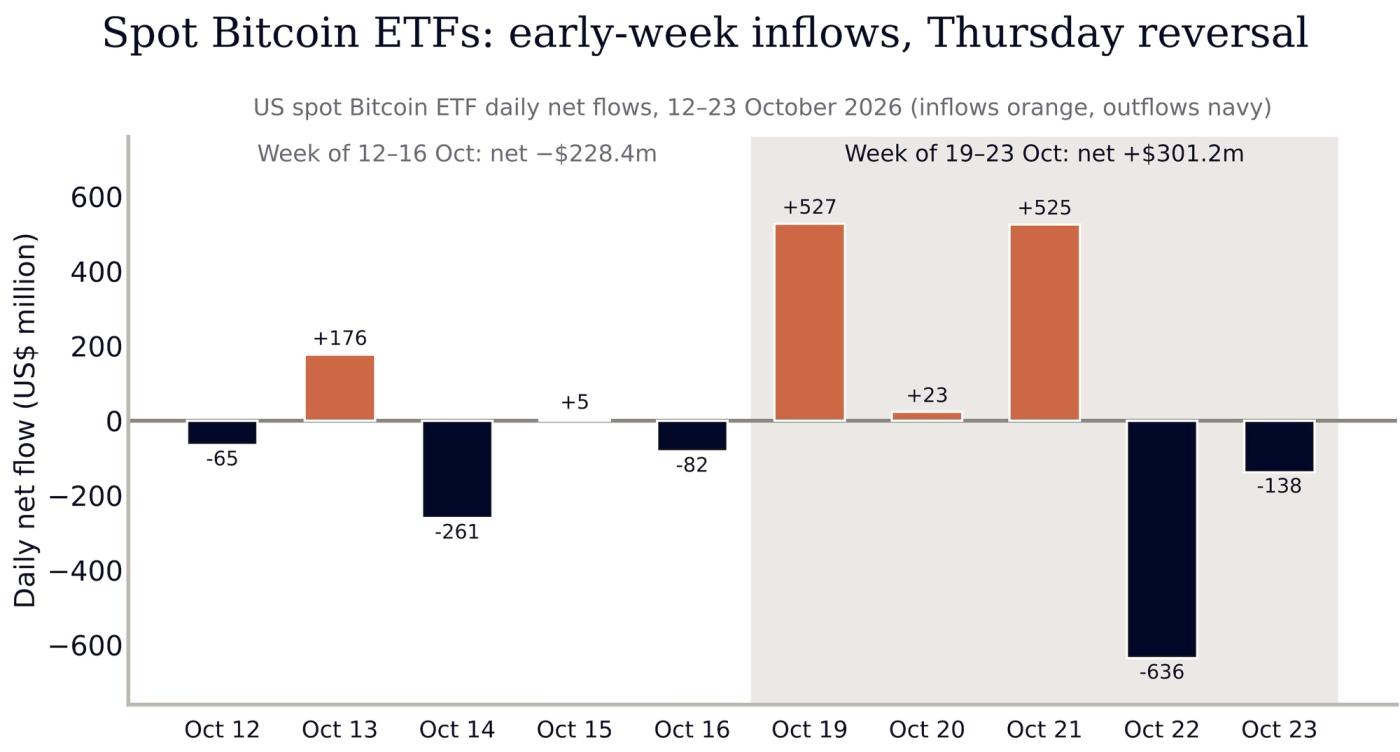
US spot Bitcoin ETFs swung sharply but still ended the week with net inflows. Monday to Wednesday brought in about $1.07 billion, led by a $665 million day for BlackRock's IBIT, its strongest session since October 2025. Thursday then saw $636 million of outflows, the largest daily withdrawal since June 25, with IBIT, Fidelity's FBTC and ARK's ARKB all posting redemptions. Another $138 million flowed out on Friday, leaving the week with net inflows of $301 million and October with net outflows of about $314 million. Cumulative net inflows since launch stand near $57.6 billion, with assets of about $100 billion. Spot Ether ETFs lost $221 million on the week, taking October outflows to about $1.18 billion, the largest monthly outflow of 2026.
Daily net flows of US spot Bitcoin ETFs, October 12 to 23, 2026. Source: CoinMarketCap, Teroxx Research
Positioning has been reset rather than rebuilt. Total crypto open interest fell about 12% over the past seven days to roughly $336 billion, according to CoinMarketCap, as leveraged longs were forced out. Liquidations exceeded $440 million on Thursday, $397 million of them longs, and a further $810 million was cleared around the weekend dip. Bitcoin now also trades below the average spot ETF cost basis of about $82,300 estimated by Glassnode, which leaves recent ETF buyers underwater. Bitcoin dominance reached 60%, its highest since May, as altcoins slid and memecoin and DeFi indices lost between 2.5% and more than 5%. This rotation toward Bitcoin points to defensive positioning, not fresh risk appetite.
Regulation delivered steady progress on stablecoins, even as broader market structure reform remains stalled. On October 21 the Office of the Comptroller of the Currency (OCC) finalized its GENIUS Act rule on reserves, redemptions, custody and issuer supervision, effective January 18, 2027. By contrast, the CLARITY Act has not advanced since its Senate cloture vote failed in mid-September, and industry executives warn that the delay hands Asia and the Middle East a competitive edge. The SEC's crypto custody proposal for advisers and funds also remains open for comment. For European market participants, a clear US stablecoin regime narrows the gap with MiCA, although US market structure rules remain unresolved.
Monetary policy remains the main headwind for digital assets. The Federal Reserve meets on October 27 to 28 with its target range at 3.75% to 4.00% after September's hike, and futures imply roughly an 80% chance of a hold. Markets, however, still price in a further hike in December after September CPI came in at 3.7% against 3.6% expected. The 10-year Treasury yield fell from about 5.13% on Monday to around 4.97%, helped by a 19-basis-point drop on Thursday, the largest since March 2023. That decline reflected a flight to safety rather than expectations of easier policy. The Bank of Japan meets on October 29 to 30 and is expected to hold at 1.25%, with a December move widely anticipated.
Geopolitics added a second source of pressure through energy prices. Brent crude rose about 6% on the week, its third consecutive weekly gain, and topped $116 per barrel on Friday, a six-month high. Houthi attacks on a Saudi airport and oil facilities prompted the US to withdraw non-essential staff, while traders weighed whether Washington would pursue a deal with Tehran or renewed military action. Brent eased about 2% to $114.60 early Monday on hopes that hostilities may cool. Higher oil prices feed directly into US inflation expectations, with one-year expectations at 4.7% in the University of Michigan survey. In our view, this link between oil, inflation and Fed tightening is the key macro channel for digital assets.
What It Means for Investors
Near term, Bitcoin sits at an important level with limited conviction either way. The $80,000 area is the first test, with $78,400 the next support cited by analysts and $75,000 a level some market participants are watching. A sustained recovery above $82,500 and the ETF cost basis of about $82,300 would signal that dip buyers have returned, while a daily close below $78,400 would point to a deeper correction. Options markets reflect this caution, with Derive pricing about a 10% chance of Bitcoin trading above $100,000 by Christmas. This week's Fed statement, US GDP and September PCE data, and megacap tech earnings are the likely catalysts. Lower leverage reduces the risk of forced selling but does not by itself create demand.
Over a longer horizon, the structural picture is more balanced than the price action suggests. ETF assets remain around $100 billion, cumulative inflows near $57.6 billion show durable institutional ownership, and the US stablecoin framework now has a clear start date. Against that, Bitcoin remains roughly 36% below its $126,000 record, and demand for Ether ETFs has weakened markedly. For shorter-term investors, the key indicators are daily ETF flows, the 10-year yield around 5%, Brent above $110 and pricing for the Fed's December meeting. In our view, a sustained return of ETF inflows alongside stable yields would be the most reliable signal that the current consolidation is ending.
Bitcoin Holds $80,000 as Brent Nears $110 Ahead of the Fed
Bitcoin held $80,000 after US inflation data as spot ETFs lost $228 million and Brent hit $109.86. The Fed decides on October 28.